Macro Z Height Map/de
| Beschreibung |
|---|
| Erstellt eine Graustufen-Höhenkarte in Z. Versionsmakro : 0.1 Datum der letzten Änderung : 2022-08-28 Autor: heda |
| Autor |
| heda |
| Herunterladen |
| None |
| Links |
| Makros Rezepte Wie man Makros installiert Symbolleisten anpassen |
| Macro-Version |
| 0.1 |
| Datum der letzten Änderung |
| 2022-08-28 |
| FreeCAD-Version(s) |
| None |
| Standardverknüpfung |
| None |
| Siehe auch |
| None |
Beschreibung
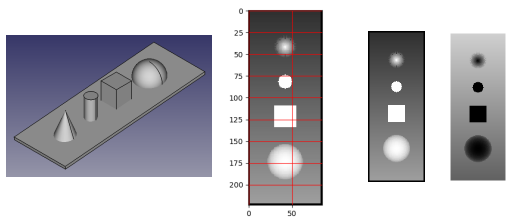
Erstellt eine Graustufen-Höhenkarte aus allen sichtbaren Objekten mit einem Volumen im aktiven Dokument. Es gibt keine grafische Benutzeroberfläche, Optionen können in der Makrodatei festgelegt werden, die Bilddatei wird unter dem Namen des Dokuments gespeichert.
Anwendung
Das Makro mit einem geöffneten Dokument ausführen.
Installieren
Mittels des Addon-Managers.
Verweis
Forum: Kein spezifischer Faden, aber der Ursprung liegt in diesem Forenbeitrag.
Version
v0.1 2022-08-28 : erste Veröffentlichung
Skript
Macro_Z_height_map.FCMacro
#!/usr/bin/env python3
# -*- coding: utf-8 -*-

# ***************************************************************************
# *   Copyright (c) 2022 heda <heda @ freecad forum>                        *
# *                                                                         *
# *   This file is part of the FreeCAD CAx development system.              *
# *                                                                         *
# *   This program is free software; you can redistribute it and/or modify  *
# *   it under the terms of the GNU Lesser General Public License (LGPL)    *
# *   as published by the Free Software Foundation; either version 2 of     *
# *   the License, or (at your option) any later version.                   *
# *   for detail see the LICENCE text file.                                 *
# *                                                                         *
# *   This program is distributed in the hope that it will be useful,       *
# *   but WITHOUT ANY WARRANTY; without even the implied warranty of        *
# *   MERCHANTABILITY or FITNESS FOR A PARTICULAR PURPOSE.  See the         *
# *   GNU Library General Public License for more details.                  *
# *                                                                         *
# *   You should have received a copy of the GNU Library General Public     *
# *   License along with this program; if not, write to the Free Software   *
# *   Foundation, Inc., 59 Temple Place, Suite 330, Boston, MA  02111-1307  *
# *   USA                                                                   *
# *                                                                         *
# ***************************************************************************


__Name__ = 'Z_height_map'
__Comment__ = 'Makes a grayscale heightmap in z'
__Author__ = 'heda @ fc-forum'
__Version__ = '0.1'
__Date__ = '2022-08-28'
__License__ = 'LGPL-2.0-or-later'
__Web__ = ''
__Wiki__ = 'https://wiki.freecad.org/Macro_Z_height_map'
__Icon__ = ''
__Help__ = 'Run macro and heightmap is created.'
__Status__ = 'Stable'
__Requires__ = 'tested on FreeCAD v0.20'
__Communication__ = 'forum'
__Files__ = ''


__doc__ = """
Makes the grayscale height map for all visible root objects with a volume
from the active document.

No gui, options can be set in macro-file.

png file saved with document name.
"""

import numpy as np
import matplotlib.pyplot as plt
from PIL import Image

pxpmm = 1 # pixels per mm
# adjust pxpmm up/down if there are bands in the heightmap
pad = 2
grayscale_compress = 0.1 # range 0 - 1
invert = False # grayscale, high is white with False

IMSHOW = True
IMSAVE = True
IMRESIZE = False # only saved pil-image, quicker than increase of pxpmm
imwidth = 500 # resizing does give artefacts, can change interpolation...

doc = App.ActiveDocument

shapes = list()
for obj in doc.Objects:
    if hasattr(obj, 'Shape'):
        if hasattr(obj.Shape, 'Volume'):
            if obj.Shape.Volume > 0:
                if obj.ViewObject.Visibility:
                    shapes.append(obj.Shape)

xmin, ymin, zmin =  (min((getattr(shp.BoundBox, f'{which}Min')
                          for shp in shapes)) for which in 'XYZ')
xmax, ymax, zmax =  (max((getattr(shp.BoundBox, f'{which}Max')
                          for shp in shapes)) for which in 'XYZ')

xspan, yspan, zspan = xmax - xmin, ymax - ymin, zmax - zmin
w, h = (int(span * pxpmm) for span in (xspan, yspan))
pic = np.zeros((w + 1, h + 1, len(shapes)))

print('w x h --> {} x {}'.format(w, h))
print('working on pixels, might take a while...')

for i, shape in enumerate(shapes):
    pv = shape.getPoints(1/pxpmm)
    zpoints = (p for p, v in zip(*pv) if v.z > 0)
    for zpoint in zpoints:
        x = round((zpoint.x - xmin) / xspan * w)
        y = round((zpoint.y - ymin) / yspan * h)
        pic[x, y, i] = zpoint.z

print('pic loop done')

pic = (pic.max(axis=2) - zmin) / zspan
im = np.zeros((w + 1 + 2 * pad, h + 1 + 2 * pad))
pic = (1 - grayscale_compress) * pic + grayscale_compress
im[pad:pad + w + 1, pad:pad + h + 1] = pic
im = (im.T * 255).astype(np.uint8)
h, w = im.shape

if invert:
    im = 255 - im
    print('grayscale inverted')

if IMSHOW:
    plt.imshow(im, cmap='gray', interpolation='none')
    plt.grid(color='r')
    plt.show()

if IMSAVE:
    with Image.fromarray(im, mode='L') as pim:
        if IMRESIZE:
            pim = pim.resize((imwidth, int(h * imwidth / w)),
                             Image.Resampling.LANCZOS)
            print('resized to:', pim.size)
        pim.save('{}.png'.format(doc.Name), mode='L')

print('height map done')
