FEM PostHistogram
|
|
| Menu location |
|---|
| Results → Data Visualizations → Create Histogram |
| Workbenches |
| FEM |
| Default shortcut |
| None |
| Introduced in version |
| 1.1 |
| See also |
| FEM tutorial |
Description
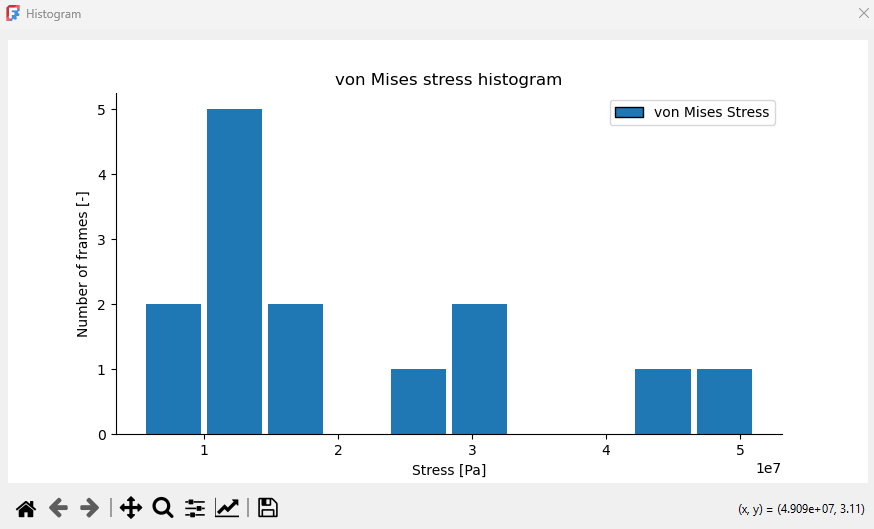
The FEM PostHistogram function creates a histogram based on data from a selected pipeline or filter.
Example of a histogram
Usage
- There are several ways to invoke the command:
- Press the
Create Histogram button.
- Select the Results → Data Visualizations →
Create Histogram option from the menu.
- Press the
- The task panel is opened.
- Press the Add data from button, select a pipeline or filter as a data source and one of two types of histograms from the drop-down list:
add FieldData - uses selected output variable and results from all nodes, the X-axis shows the output variable values while the Y-axis shows the number of nodes so the plot visualizes how many nodes have a given value of output variable; if the One field for each frame checkbox is enabled, there are separate bars for each frame
add IndexOverFrames - uses selected output variable and results from a node with a specified index (number), the X-axis shows the output variable values while the Y-axis shows number of frames so the plot visualizes how many frames have a given value of output variable at the selected node
- Configure the histogram:
- Press the middle button by default showing Index to set the output data source and index.
- Press the 3rd button from the left by default showing blue rectangle to set the histogram bar and line appearance.
- Press the rightmost button with X symbol to delete the Histogram object.
- Press the OK button to finish.
- Set Histogram view settings - number of Bins, Type, Cumulative (shows how many values fall up to and including each bin - cumulative sum from left to right) or not, Legend and its location and type the labels (Title, X Axis, Y Axis) as well as change the Bar width and Hatch Line Width.
- Press the Show plot button to display the histogram plot.
- Press the Show data button to display a table with data used for the histogram.
- Press the OK button to finish and close the task panel.
- Materials: Solid, Fluid, Nonlinear mechanical, Reinforced (concrete); Material editor
- Element geometry: Beam (1D), Beam rotation (1D), Shell (2D), Fluid flow (1D)
Constraints
- Electromagnetic: Electrostatic potential, Current density, Magnetization
- Geometrical: Plane rotation, Section print, Transform
- Mechanical: Fixed, Displacement, Contact, Tie, Spring, Force, Pressure, Centrif, Self weight
- Thermal: Initial temperature, Heat flux, Temperature, Body heat source
- Overwrite Constants: Constant vacuum permittivity
- Solve: CalculiX Standard, Elmer, Mystran, Z88; Equations: Deformation, Elasticity, Electrostatic, Electricforce, Magnetodynamic, Magnetodynamic 2D, Flow, Flux, Heat; Solver: Solver control, Solver run
- Results: Purge, Show; Postprocessing: Apply changes, Pipeline from result, Warp filter, Scalar clip filter, Function cut filter, Region clip filter, Contours filter, Line clip filter, Stress linearization plot, Data at point clip filter, Filter function plane, Filter function sphere, Filter function cylinder, Filter function box
- Additional: Preferences; FEM Install, FEM Mesh, FEM Solver, FEM CalculiX, FEM Concrete; FEM Element Types
- Getting started
- Installation: Download, Windows, Linux, Mac, Additional components, Docker, AppImage, Ubuntu Snap
- Basics: About FreeCAD, Interface, Mouse navigation, Selection methods, Object name, Preferences, Workbenches, Document structure, Properties, Help FreeCAD, Donate
- Help: Tutorials, Video tutorials
- Workbenches: Std Base, Assembly, BIM, CAM, Draft, FEM, Inspection, Material, Mesh, OpenSCAD, Part, PartDesign, Points, Reverse Engineering, Robot, Sketcher, Spreadsheet, Surface, TechDraw, Test Framework
- Hubs: User hub, Power users hub, Developer hub
