FEM PostPipelineFromResult/it
|
|
| Posizione nel menu |
|---|
| Risultati → Post Pipeline da risultato |
| Ambiente |
| FEM |
| Avvio veloce |
| Nessuno |
| Introdotto nella versione |
| 0.17 |
| Vedere anche |
| Tutorial FEM |
Description
Descrizione
Pipeline è un oggetto risultato, che crea una nuova rappresentazione grafica dei risultati dell'analisi FEM sulla parte analizzata. Aggiunge scala di colori e più opzioni di visualizzazione.
introduced in 1.1: The results pipeline can store results from multiple frames. To switch between the different frames, select them from the list.
Usage
Utilizzo
- Serve un oggetto risultato valido nel
 contenitore Analisi, come CalculiX_static_results.
 - Selezionare l'oggetto risultato
- Fare clic sul pulsante
 , oppure fare clic sul menu Risultati e sull'elemento Post Pipeline from results. Al documento viene aggiunto un nuovo oggetto chiamato "Pipeline" ; notare che appare al di fuori del contenitore delle analisi.
 - Fare doppio clic sul nuovo oggetto Pipeline nell'albero del modello e selezionare il tipo di proprietà da visualizzare. Le impostazioni tipiche sono: Mode: selezionare Superficie, Field: I.e. Von Mises stress
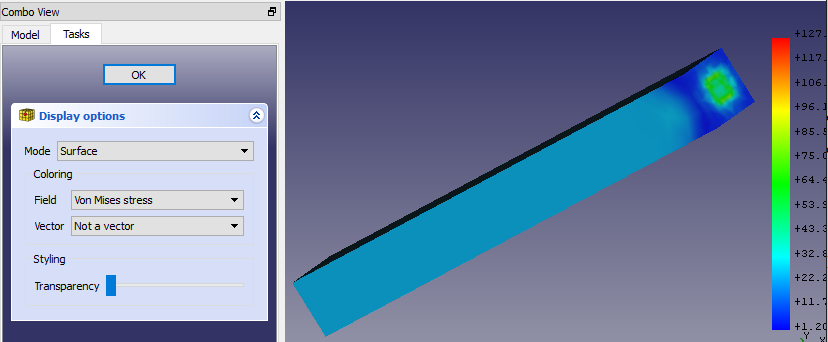
- Mode: come disegnare i risultati
- Field: quale proprietà risultato disegnare
- Vector: se una proprietà è un vettore, è possibile limitare i dati a un asse (X, Y, Z) o selezionare Magnitudine per utilizzare il valore vettoriale.
- Se non si vede alcun modello nell'area grafica, andare a Modifica → Preferenze, selezionare Visualizazione e attivare la casella Abilita il colore di retroilluminazione
- Facendo doppio clic sulla scala, è possibile modificare le proprietà di visualizzazione.


- Gradiente: si può selezionare l'ordine inverso del gradiente di colore predefinito o Nero-Bianco o Bianco-Nero.
- Intervallo parametri: i valori minimo e massimo vengono inseriti automaticamente quando si seleziona una proprietà da valutare sull'oggetto Pipeline; è possibile modificarli, accertarsi però di sapere cosa si sta facendo. È inoltre possibile modificare il numero di etichette visualizzate e il numero di posizioni decimali da visualizzare.
If you see no model in the graphical area, go to and enable Edit → Preferences → Display → 3D View → Rendering → Backlight color.
If you use a SI-derived FreeCAD unit system, the values in the output scale are based on SI units as well. This means the displacement is in meter, the stress is in Pascal and the temperature is in Kelvin.
Data and extractions
introduced in 1.1: In the Data and extractions section, available also in the task panels of pipeline filters, multiple tools for simulation result data processing are available.
- The Data Summary button displays a table with min and max values of all output variables while the Show Data button displays a table with values of all output variables for all nodes. Thus, the table can be very large.
- The Export to CSV button makes it possible to export the table to .csv file for external use.
- The Copy selection to clipboard button (shortcut Ctrl+C) can be used to copy the table to clipboard.
- The New button allows adding new data objects to the Data and extractions tab based on FieldData (results from all nodes) or IndexOverFrames (results from node with a selected number):
- New Lineplot - creates XY plot
- with FieldData - X- and Y-axis can be configured to show any output variables, results are taken from all nodes
- with IndexOverFrames - Y-axis can be configured to show any output variable, X-axis shows time/frequency (based on the frames), results are taken only from a node with a specified index (number)
- New Histogram - creates histogram plot
- with FieldData - uses selected output variable and results from all nodes
- with IndexOverFrames - uses selected output variable and results from a node with a specified index (number)
- New Table - creates a table
- with FieldData - lists values of a selected output variable for all nodes
- with IndexOverFrames - lists values of a selected output variable for a node with a specified index (number) in each frame
- New Lineplot - creates XY plot
- The Add data to button adds data from the current filter to the selected existing data extraction object
Properties
Dialog box
This pipeline dialog box has the following settings:
- Mode: How to draw the results. The possible modes are
- Outline: The outline of the result mesh. In fact, it displays no results but only the borders of the mesh.
- Nodes: The result mesh nodes.
- Surface: This is the default and displays the surface of the result mesh.
- Surface with Edges: Like Surface but with the mesh outline edges and the surface mesh node connection lines.
- Field: Which result property to draw.
- Vector: Is only active if the Field is a vector. You can select whether to display the vector Magnitude or its X, Y, Z components.
Scale
If you double-click on the scale, you get this settings dialog box:
and you can modify these properties:
- Gradient: You can select reversed order of the default color gradient, Red-White-Blue, Black-White or White-Black.
- Style: The default option Flow uses the full color gradient range. The option Zero uses only the color gradient range starting from the color that would display the mean value to the maximum.
- Visibility: The option Out grayed will color all mesh nodes whose values are outside the set minimum/maximum range in gray. The option Out transparent will make these mesh nodes transparent.
- Parameter range: Minimum and maximum values are filled-in automatically. You can modify them, however make sure you know what you are doing. You can also change the number of displayed decimal places and the number of labels distributed over the parameter range.
Property Editor
In the Property View you can set in the View tab the settings from the dialog box. In the Data tab you can additionally set this:
- DatiMode: How the filters used in the pipeline will be treated. These modes are possible:
- Serial: In this mode every filter takes the previous filter as input. The order is hereby the order of creation. The first created filter takes the pipeline as input. Its Input property is therefore empty.
- Parallel: In this mode all filters take the pipeline as input.
- Custom: This is the default and keeps the input of the filters as they are. Therefore it allows to have e.g. two filters that take the pipeline as input, and a third filter that takes one of the two filters as input.
Scripting
introduced in 1.2: The addArrayFromFunction function can be used to create custom arrays based on the pipeline fields. For example, send the pipeline to the Python Console and use the following command to obtain a temperature field in Celsius degrees instead of Kelvins:
obj.addArrayFromFunction({"temp_C": "Temperature - 273"})
- Materials: Solid Material, Fluid Material, Non-Linear Mechanical Material, Reinforced Material (Concrete); Material Editor
- Element Geometry: Beam Cross Section, Beam Rotation, Shell Plate Thickness, Fluid Section for 1D Flow
- Electromagnetic Boundary Conditions: Electrostatic Potential Boundary Condition, Current Density Boundary Condition, Magnetization Boundary Condition, Electric Charge Density
- Fluid Boundary Conditions: Initial Flow Velocity Condition, Initial Pressure Condition, Flow Velocity Boundary Condition
- Geometrical Analysis Features: Plane Multi-Point Constraint, Section Print Feature, Local Coordinate System
- Mechanical Boundary Conditions and Loads: Fixed Boundary Condition, Rigid Body Constraint, Displacement Boundary Condition, Contact Constraint, Tie Constraint, Spring Boundary Condition, Force Load, Pressure Load, Centrifugal Load, Gravity Load
- Thermal Boundary Conditions and Loads: Initial Temperature, Heat Flux Load, Temperature Boundary Condition, Body Heat Source
- Overwrite Constants: Constant Vacuum Permittivity
- Mesh: Mesh From Shape by Netgen, Mesh From Shape by Gmsh, Mesh Boundary Layer, Mesh Refinement, Mesh Group, Erase Elements, FEM Mesh to Mesh
- Solve: Solver CalculiX, Solver Elmer, Solver Mystran, Solver Z88; Mechanical Equations: Elasticity Equation, Deformation Equation; Electromagnetic Equations: Electrostatic Equation, Electricforce Equation, Magnetodynamic Equation, Magnetodynamic 2D Equation, Static Current Equation; Flow Equation, Flux Equation, Heat Equation, Solver Job Control, Run Solver
- Results: Purge Results, Show Result, Apply Changes to Pipeline, Post Pipeline From Result, Pipeline Branch, Warp Filter, Scalar Clip Filter, Function Cut Filter, Region Clip Filter, Contours Filter, Glyph Filter, Line Clip Filter, Stress Linearization Plot, Data at Point Clip Filter, Calculator Filter; Filter Functions: Plane, Sphere, Cylinder, Box; Data Visualizations: Create Lineplot, Create Histogram, Create Table
- Utilities: Clipping Plane on Face, Remove All Clipping Planes, FEM Examples; Clear FEM Mesh, Display Mesh Info
- Additional: Preferences; FEM Install, FEM Mesh, FEM Solver, FEM CalculiX, FEM Concrete; FEM Element Types
- Getting started
- Installation: Download, Windows, Linux, Mac, Additional components, Docker, AppImage, Ubuntu Snap
- Basics: About FreeCAD, Interface, Mouse navigation, Selection methods, Object name, Preferences, Workbenches, Document structure, Properties, Help FreeCAD, Donate
- Help: Tutorials, Video tutorials
- Workbenches: Std Base, Assembly, BIM, CAM, Draft, FEM, Inspection, Material, Mesh, OpenSCAD, Part, PartDesign, Points, Reverse Engineering, Robot, Sketcher, Spreadsheet, Surface, TechDraw, Test Framework
- Hubs: User hub, Power users hub, Developer hub