FEM PostLineplot/de
|
|
| Menüeintrag |
|---|
| Ergebnisse → Datenvisualisierungen → Liniendiagram erstellen |
| Arbeitsbereich |
| FEM |
| Standardtastenkürzel |
| Keiner |
| Eingeführt in Version |
| 1.1 |
| Siehe auch |
| FEM Tutorium |
Beschreibung
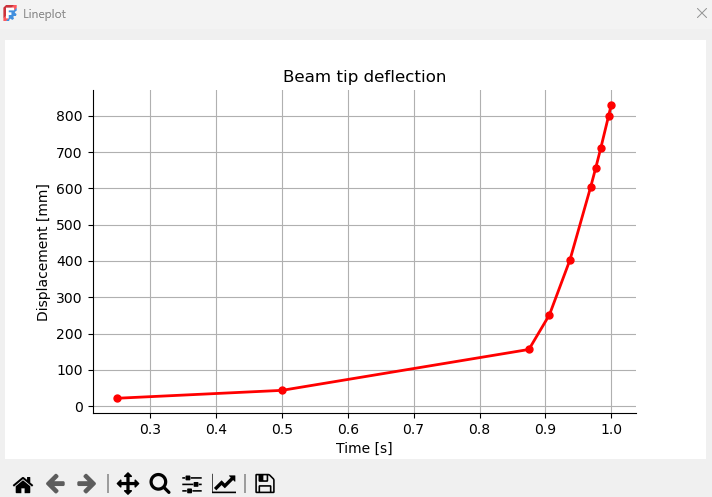
Die FEM NachbereitungLiniediagramm Funktion erstellt ein Liniendiagramm, basierend auf den Daten einer ausgewählten Pipeline oder Filter.
Beispiel eines Liniendiagramms
Anwendung
- Es gibt mehrere Möglichkeiten, den Befehl aufzurufen:
- Die Schaltfläche
Liniendiagramm erstellen drücken.
- Die Option Ergebnisse → Datenvisualisierungen →
Liniendiagramm erstellen aus dem Menü wählen.
- Die Schaltfläche
- Das Aufgaben-Fenster wird geöffnet.
- Die Schaltfläche Daten hinzufügen aus drücken, eine Pipeline oder einen Filter als Datenquelle und einen von zwei Diagrammtypen aus der Dropdown-Liste auswählen:
Felddaten hinzufügen – Die X- und Y-Achse können so konfiguriert werden, dass sie beliebige Ausgabevariablen anzeigen. Die Ergebnisse werden aus allen Knoten übernommen. Wenn das Kontrollkästchen Ein Y-Feld für jeden Rahmen aktiviert ist, gibt es für jeden Rahmen eine separate Kurve, die die Y-Achsen-Feldausgabe darstellt.
IndexOverFrames hinzufügen – Die Y-Achse kann so konfiguriert werden, dass sie beliebige Ausgabevariablen anzeigt, die X-Achse zeigt Zeit/Frequenz (basierend auf den Frames), die Ergebnisse werden nur von einem Knoten mit einem bestimmten Index (Nummer) übernommen
- Die Darstellung konfigurieren:
- Die mittlere Taste drücken, die standardmäßig Position (X) anzeigt, um die Daten und den Index der X/Y-Achse festzulegen.
- Die dritte Taste von links drücken, die standardmäßig eine blaue Linie anzeigt, um das Aussehen der Darstellungslinie festzulegen.
- Die Taste ganz rechts mit dem X-Symbol drücken, um das Diagrammobjekt zu löschen.
- Die Einstellungen für die Linienplot-Ansicht festlegen – das Raster zeigen oder verbergen, die Legende und deren Position, die Achsen-Skala und die Beschriftungen (Titel, X-Achse, Y-Achse) eingeben.
- Die Taste Diagramm anzeigen drücken, um das Diagramm anzuzeigen.
- Die Schaltfläche Daten anzeigen drücken, um eine Tabelle mit den für die Darstellung verwendeten Daten anzuzeigen.
- Die Schaltfläche OK drücken, um den Vorgang abzuschließen und das Aufgaben-Fenster zu schließen.
- Materials: Solid Material, Fluid Material, Non-Linear Mechanical Material, Reinforced Material (Concrete); Material Editor
- Element Geometry: Beam Cross Section, Beam Rotation, Shell Plate Thickness, Fluid Section for 1D Flow
- Electromagnetic Boundary Conditions: Electrostatic Potential Boundary Condition, Current Density Boundary Condition, Magnetization Boundary Condition, Electric Charge Density
- Fluid Boundary Conditions: Initial Flow Velocity Condition, Initial Pressure Condition, Flow Velocity Boundary Condition
- Geometrical Analysis Features: Plane Multi-Point Constraint, Section Print Feature, Local Coordinate System
- Mechanical Boundary Conditions and Loads: Fixed Boundary Condition, Rigid Body Constraint, Displacement Boundary Condition, Contact Constraint, Tie Constraint, Spring Boundary Condition, Force Load, Pressure Load, Centrifugal Load, Gravity Load
- Thermal Boundary Conditions and Loads: Initial Temperature, Heat Flux Load, Temperature Boundary Condition, Body Heat Source
- Overwrite Constants: Constant Vacuum Permittivity
- Mesh: Mesh From Shape by Netgen, Mesh From Shape by Gmsh, Mesh Boundary Layer, Mesh Refinement, Mesh Group, Erase Elements, FEM Mesh to Mesh
- Solve: Solver CalculiX, Solver Elmer, Solver Mystran, Solver Z88; Mechanical Equations: Elasticity Equation, Deformation Equation; Electromagnetic Equations: Electrostatic Equation, Electricforce Equation, Magnetodynamic Equation, Magnetodynamic 2D Equation, Static Current Equation; Flow Equation, Flux Equation, Heat Equation, Solver Job Control, Run Solver
- Results: Purge Results, Show Result, Apply Changes to Pipeline, Post Pipeline From Result, Pipeline Branch, Warp Filter, Scalar Clip Filter, Function Cut Filter, Region Clip Filter, Contours Filter, Glyph Filter, Line Clip Filter, Stress Linearization Plot, Data at Point Clip Filter, Calculator Filter; Filter Functions: Plane, Sphere, Cylinder, Box; Data Visualizations: Create Lineplot, Create Histogram, Create Table
- Utilities: Clipping Plane on Face, Remove All Clipping Planes, FEM Examples; Clear FEM Mesh, Display Mesh Info
- Additional: Preferences; FEM Install, FEM Mesh, FEM Solver, FEM CalculiX, FEM Concrete; FEM Element Types
- Erste Schritte
- Installation: Herunterladen, Windows, Linux, Mac, Zusätzliche Komponenten, Docker, AppImage, Ubuntu Snap
- Grundlagen: Über FreeCAD, Graphische Oberfläche, Mausbedienung, Auswahlmethoden, Objektname, Voreinstellungseditor, Arbeitsbereiche, Dokumentstruktur, Objekteigenschaften, FreeCAD unterstützen, Spenden
- Hilfe: Anleitungen, Videoanleitungen
- Arbeitsbereiche: Std Base, Arch, Assembly, BIM, CAM, Draft, FEM, Inspection, Material, Mesh, OpenSCAD, Part, PartDesign, Points, Reverse Engineering, Robot, Sketcher, Spreadsheet, Surface, TechDraw, Test Framework
