FEM ResultShow/de
|
|
| Menüeintrag |
|---|
| Ergebnisse → Ergebnis anzeigen |
| Arbeitsbereich |
| FEM |
| Standardtastenkürzel |
| R S |
| Eingeführt in Version |
| - |
| Siehe auch |
| Keiner |
Beschreibung
Der Befehl ErgebnisAnzeigen öffnet das Dialogfeld für ein FEM-Ergebnisobjekt. Ein Ergebnisobjekt wird automatisch erstellt, wenn eine FEM-Analyse mit dem Löser Calculix oder Z88 durchgeführt wurde.
Ein Ergebnisobjekt enthält das resultierende Netz und kann die Ergebnisse visualisieren. Es ist für thermomechanische Ergebnisse konzipiert und daher auf diese beschränkt. Mit Ausnahme des Lösers Elmer, es kann als Alternative zu einer Ergebnis-Pipeline. Eine Ergebnis-Pipeline kann zur Visualisierung beliebiger Ergebnisse (auch elektrischer usw.) verwendet werden.
Die für das Ergebnisobjekt verwendeten Einheiten sind die des festgelegten Einheitensystems, während für die Ergebnis-Pipelines die Einheiten SI verwendet werden.
Die Visualisierung der Ergebnisse ist nur aktiv, wenn der Dialog geöffnet ist. Die Dialogeinstellungen werden jedoch in der FreeCAD-Modelldatei gespeichert.
Anwendung
- Wähle das Ergebnisobjekt in der Baumansicht aus.
- Es gibt mehrere Möglichkeiten, den Befehl aufzurufen:
- Die Schaltfläche
Ergebnis anzeigen drücken.
- Aus dem Menü die Option Ergebnisse →
Zeige Ergebnis wählen.
- Die Tastenkombination: R dann S.
- Die Schaltfläche
- Alternativ kann auch auf das Ergebnisobjekt in der Baumansicht doppelt geklickt werden.
Wenn der Dialog offen ist, wird das Ergebnis-Netz automatisch angezeigt.

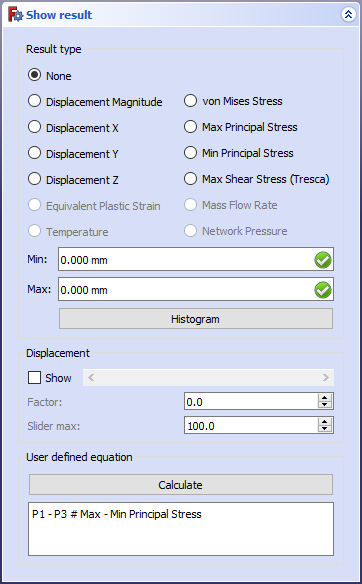
Der Dialog wird links angezeigt und bietet die folgenden Funktionen:
- Wähle einen Ergebnistyp aus, woraufhin der Mindest- und Höchstwert im Dialogfeld angezeigt wird. Das Ergebnisnetz wird entsprechend eingefärbt.
- Klicke auf die Schaltfläche Histogramm um ein Histogramm zu erhalten, das angibt, wie viele Ergebnis-Netzknoten ein bestimmtes Ergebnis haben. Die Darstellung des Histogramms kann über die Schaltflächen in der Symbolleiste geändert werden. Es ist auch möglich, das Histogramm über die Schaltfläche „Speichern“ in der Symbolleiste als Bild zu speichern.
- Die Option Anzeigen aktivieren, um den Schieberegler zu aktivieren und die Verformung des Ergebnisgitters zu visualisieren. Der Wert des Schiebereglers ist ein Faktor, mit dem das Ergebnis Verschiebungsgröße multipliziert wird.
Hinweis: Der Schieberegler wirkt sich nur auf die Verschiebungsgröße aus, nicht auf die X-, Y- und Z-Komponenten. Man kann den Faktor direkt einstellen und Schieberegler max. ändern, um den Bereich des Schiebereglers anzupassen.
- eingeführt in 1.1: Auf die Schaltfläche Animation starten klicken, um die Ergebnisse mit dem aktuell eingestellten Verformungsfaktor zu animieren. Auf Animation stoppen klicken oder das Aufgaben-Fenster schließen, um die Animation zu beenden. Man kann die Anzahl der Schritte pro Zyklus (wie viele Verformungszustände/Schritte bis zum definierten Faktor in jeder Schleife angezeigt werden), die Anzahl der Zyklen (wie viele Schleifen die Animation durchläuft) und die Bildrate (wie schnell die Animation läuft – Schritte pro Sekunde) einstellen.
- Mit der Schaltfläche Berechnen kann man Berechnungen der Ergebnisse durchführen. Man gibt in das Textfeld unterhalb der Schaltfläche eine Gleichung der Wahl ein. Vordefiniert ist die Gleichung P1-P3. Das bedeutet, dass das Ergebnis Min. Hauptspannung von der Max. Hauptspannung subtrahiert wird. Die Variablen für die möglichen Ergebnisse werden im Feld Benutzerdefinierte Gleichung erläutert. Nachdem man eine Gleichung eingegeben hat, drückt man die Schaltfläche, und das Ergebnis wird in den Feldern angezeigt, die das Minimum und Maximum anzeigen. Das Ergebnisnetz wird entsprechend eingefärbt.
Hinweis: Die Berechnungsergebnisse haben immer die Einheit MPa, mm oder T, unabhängig davon, welches Einheitensystem man verwendet.
- Materials: Solid Material, Fluid Material, Non-Linear Mechanical Material, Reinforced Material (Concrete); Material Editor
- Element Geometry: Beam Cross Section, Beam Rotation, Shell Plate Thickness, Fluid Section for 1D Flow
- Electromagnetic Boundary Conditions: Electrostatic Potential Boundary Condition, Current Density Boundary Condition, Magnetization Boundary Condition, Electric Charge Density
- Fluid Boundary Conditions: Initial Flow Velocity Condition, Initial Pressure Condition, Flow Velocity Boundary Condition
- Geometrical Analysis Features: Plane Multi-Point Constraint, Section Print Feature, Local Coordinate System
- Mechanical Boundary Conditions and Loads: Fixed Boundary Condition, Rigid Body Constraint, Displacement Boundary Condition, Contact Constraint, Tie Constraint, Spring Boundary Condition, Force Load, Pressure Load, Centrifugal Load, Gravity Load
- Thermal Boundary Conditions and Loads: Initial Temperature, Heat Flux Load, Temperature Boundary Condition, Body Heat Source
- Overwrite Constants: Constant Vacuum Permittivity
- Mesh: Mesh From Shape by Netgen, Mesh From Shape by Gmsh, Mesh Boundary Layer, Mesh Refinement, Mesh Group, Erase Elements, FEM Mesh to Mesh
- Solve: Solver CalculiX, Solver Elmer, Solver Mystran, Solver Z88; Mechanical Equations: Elasticity Equation, Deformation Equation; Electromagnetic Equations: Electrostatic Equation, Electricforce Equation, Magnetodynamic Equation, Magnetodynamic 2D Equation, Static Current Equation; Flow Equation, Flux Equation, Heat Equation, Solver Job Control, Run Solver
- Results: Purge Results, Show Result, Apply Changes to Pipeline, Post Pipeline From Result, Pipeline Branch, Warp Filter, Scalar Clip Filter, Function Cut Filter, Region Clip Filter, Contours Filter, Glyph Filter, Line Clip Filter, Stress Linearization Plot, Data at Point Clip Filter, Calculator Filter; Filter Functions: Plane, Sphere, Cylinder, Box; Data Visualizations: Create Lineplot, Create Histogram, Create Table
- Utilities: Clipping Plane on Face, Remove All Clipping Planes, FEM Examples; Clear FEM Mesh, Display Mesh Info
- Additional: Preferences; FEM Install, FEM Mesh, FEM Solver, FEM CalculiX, FEM Concrete; FEM Element Types
- Erste Schritte
- Installation: Herunterladen, Windows, Linux, Mac, Zusätzliche Komponenten, Docker, AppImage, Ubuntu Snap
- Grundlagen: Über FreeCAD, Graphische Oberfläche, Mausbedienung, Auswahlmethoden, Objektname, Voreinstellungseditor, Arbeitsbereiche, Dokumentstruktur, Objekteigenschaften, FreeCAD unterstützen, Spenden
- Hilfe: Anleitungen, Videoanleitungen
- Arbeitsbereiche: Std Base, Arch, Assembly, BIM, CAM, Draft, FEM, Inspection, Material, Mesh, OpenSCAD, Part, PartDesign, Points, Reverse Engineering, Robot, Sketcher, Spreadsheet, Surface, TechDraw, Test Framework